
Hot Projects
Dogecoin Rocky Recovery Path: Why DOGE Faces An Uphill Battle | EVM News
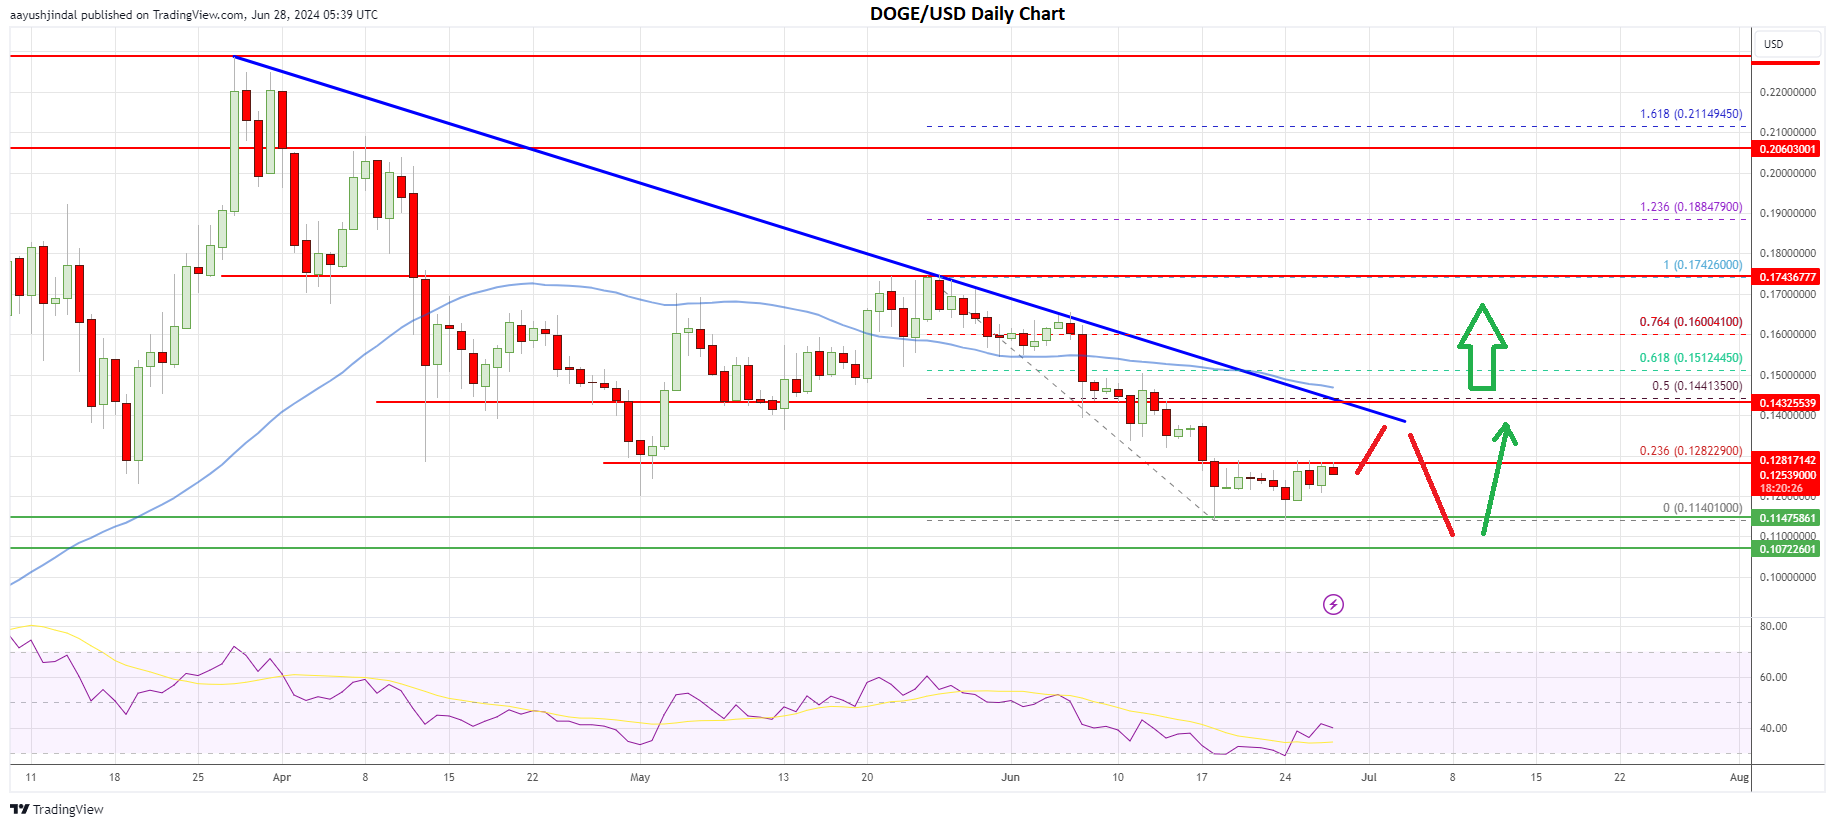
Key Takeaways:
- Dogecoin price is consolidating losses above the $0.1140 support zone.
- DOGE is trading well below a crucial bearish trend line with resistance at $0.1440 on the daily chart.
- The price could see a downside thrust toward the $0.1070 support before a fresh increase.
NEW DELHI (CoinChapter.com) — DOGE seems to be forming a base above $0.1140. Dogecoin price might attempt a recovery wave, but upsides might not be easy above $0.140.
Dogecoin Price Faces Many Challenges
In the past few weeks, Dogecoin saw a steady decline from the $0.1750 resistance zone. The price declined below the key $0.150 and $0.1440 support levels to enter a bearish zone. DOGE even underperformed Bitcoin and Ethereum and declined below the $0.1220 support.
Finally, the bulls took a stand near the $0.1140 zone. A low has formed at $0.1140 and the price is now consolidating losses. It seems to be forming a base for a short-term recovery wave and remains well below the 50-day simple moving average.
The price is now trading well below a crucial bearish trend line with resistance at $0.1440 on the daily chart. If there is a recovery wave, the price could face resistance near the 23.6% Fib retracement level of the downward move from the $0.1742 swing high to the $0.1140 low at $0.1280.
A close above the $0.1280 level might spark a move toward the $0.140 resistance. The first major resistance is forming at $0.1440 and the trend line. It coincides with the 50% Fib retracement level of the downward move from the $0.1742 swing high to the $0.1140 low.
The next key resistance sits near the 50-day simple moving average at $0.150. A daily close above the trend line and then $0.150 could open the doors for a fresh rally. In the stated case, Dogecoin could rise and test the $0.1740 resistance.
More Downsides In DOGE?
Conversely, Dogecoin might fail to recover above the $0.1280 resistance or the trend line. In the stated case, the price could see a downside flush below the $0.120 support.
The first support sits near the $0.1140 level, below which DOGE price might test the 1.236 Fib extension level of the upward move from the $0.1200 swing low to the $0.1743 high at $0.1072. If the bulls fail to defend the $0.1072 support, the price might even struggle to stay above $0.10. The next key support sits near the $0.0865 region.
Recently, VanEck filed for the first Solana exchange-traded fund (ETF) in the US. This has sparked speculation of higher chances of DOGE ETF next in the coming months.
Overall, DOGE is consolidating above the $0.1140 support. To start a strong increase, the price must settle above the $0.1440 and $0.150 resistance levels in the coming days.

Key Takeaways
- Health Concerns: Tigran Gambaryan’s health has worsened during his 128-day detention. He is suffering from double pneumonia, malaria, and aches.
- Family and U.S. Advocacy: Gambaryan’s family is concerned about his health. U.S. officials are increasingly involved and they are urging for his release on humanitarian grounds.
- Legal and Public Response: The legal team completed a key cross-examination. A petition for Gambaryan’s release has gained 4,881 signatures.
YEREVAN (CoinChapter.com) — The trial against Binance executives Tigran Gambaryan and Nadeem Anjarwalla is set to resume on July 5. Nigeria’s Economic and Financial Crimes Commission (EFCC) is pressing money laundering charges. Notably, Gambaryan has been detained since February, while Anjarwalla reportedly fled to Kenya in March.
During his 128-day detention, Gambaryan’s health has worsened. Primarily, he has suffered from double pneumonia, malaria, and ongoing aches and pains. This has raised concerns about his ability to endure the trial.
Family and U.S. Officials Advocate for Binance Executive Facing Health Issues and Legal Battle
Moreover, Gambaryan’s family is worried about his health and the slow response from authorities. A family spokesperson mentioned that Gambaryan’s legal team completed their cross-examination of an EFCC witness on July 2. His wife, Yuki, shared her frustrations, noting increased engagement from the U.S. government recently.
Yuki has been in regular contact with U.S. State Department officials and the U.S. Embassy in Abuja. As well, she believes any disputes between Binance and Nigerian authorities should not involve her husband.
“I thought the U.S. Government response was quite slow at first, especially considering that Tigran used to work for the U.S. Government,”
said Yuki
“However, I believe they have noticeably increased their efforts and engagement recently […] In my eyes, it is evident any issues between Binance and the Nigerian authorities can and should be resolved without Tigran being caught in the middle.”
Notably, U.S. officials have been involved in the case. Representatives French Hill and Chrissy Houlahan visited Gambaryan in Kuje Prison on June 20. They are urging Nigerian authorities to drop the charges on humanitarian grounds.
Petition to Free Binance Exec Gains Support as Criticism Grows
Yuki Gambaryan launched a petition to bring her husband back to the U.S., which has received 4,881 signatures so far. The petition aims to reach 5,000 signatures and will be presented to the U.S. State Department, President Joe Biden, the EFCC, and the Nigerian government.
Globally, the case has attracted widespread attention. Above all, many argue that it is unfair to hold two executives accountable for company actions during a voluntary visit to Nigeria.

NOIDA (CoinChapter.com)—Band Protocol (BAND) made significant advances in the crypto sector, and recent developments highlight the project’s commitment to expanding.
Unconfirmed social media posts suggest that Synthetix could be working on integrating Band Protocol. If true, partnership news could help BAND price confirm a bullish technical pattern.
BAND Price Formed Bullish Pattern
The Band Protocol token formed a bullish technical pattern called the ‘falling wedge.’
Bullish news, such as Bond Protocol’s making a new partnership or integrating with other projects, could help the project’s token confirm the pattern.
A falling wedge pattern features a pair of converging trend lines connecting lower highs and lower lows, forming a narrowing shape that slopes downward.
The pattern typically suggests that an asset’s price, while consolidating in a downtrend, is losing bearish momentum and preparing for a potential reversal to the upside. Typically, a breakout occurs in the direction of the overall trend, which, for a falling wedge, is upward.
To estimate the price target of a falling wedge pattern, traders measure the widest part of the wedge at the beginning of the formation. They then project this distance upward from the breakout point to set a potential target.
An accompanying increase in trading volume can further confirm the reliability of the breakout. Higher volume during the breakout suggests stronger market conviction, supporting the likelihood of a successful price reversal.
According to the rules of technical analysis, the Band Protocol token price could rally over 276% to reach the pattern’s theoretical price target near $4.6.
It is unlikely the token would rally to the projected price target immediately after confirming the pattern, but breaking out of the wedge setup could attract more buying pressure, helping the token continue its rally till profit booking puts the brakes on the run.
BAND Bulls Struggling With 20-Day EMA
BAND price climbed above its 20-day EMA (red wave) dynamic resistance as the token entered July. However, July 3’s nearly 6% drop forced the token’s price back below the EMA resistance, suggesting bears aggressively defend the supply zone near the 20-day EMA.

Bulls have their task cut out, with the token starting July 4 with minor gains. Flipping the EMA resistance with good volumes would certainly help the BAND price’s cause, helping the token rally to the resistance near $1.34.
A break above immediate resistance might see the Band Protocol token’s price target the 100-day EMA (blue wave) resistance near $1.5.
On the other hand, if BAND price fails to rally, the token could drop to the support levels near $1.14 and $1.05 before recovering.
The RSI for BAND remained neutral, with a score of 45.56 on the daily charts.

NOIDA (CoinChapter.com)— Litecoin price ended June down by nearly 10%, and so far, July has not been very kind to the blockchain platform. LTC bulls have failed to convert a recent surge in network activity into a bullish cue for the token.
However, a technical setup might help avoid LTC price more bloodshed, if the bulls manage to avoid invalidating the pattern.
Litecoin Price Testing Support Of Bullish Setup
The Litecoin token’s price has formed a bullish technical setup called the ‘ascending triangle.‘
The token’s price are currently testing the ascending trendline of the pattern. A rebound from here could infuse confidence in the token’s rally, attracting more buyers expecting a bullish breakout.
Under technical analysis, an ascending triangle pattern emerges when a horizontal trendline connects swing highs and an ascending trendline connects swing lows. The pattern indicates a consolidation period where the buyers gradually gain strength against a consistent level of resistance.
Volume analysis is critical, as it helps to validate the breakout’s strength. Typically, as the price action approaches the triangle’s apex, the volume tends to decrease, reflecting a period of reduced trading activity and uncertainty.
When the trendlines converge, creating a narrowing price range, buyers often enter the market in anticipation of a breakout. Ideally, the breakout occurs above the horizontal resistance line, accompanied by a significant increase in trading volume.
The surge in volume is a key indicator that the breakout is robust and likely to sustain.
According to the rules of technical analysis, the price target for a breakout is equal to the triangle’s height at its thickest point. If the bullish pattern pans out, the theoretical price target for LINK is near $269.5, a spike of 267% from current levels.
LTC price Fails To Conquer EMA Resistance
Litecoin price has failed to move above the 20-day EMA (red wave) dynamic resistance since June 8, with prices dropping nearly 6% to a daily low near $72 on July 3. The downtrend suggests bears are booking profits near $72.

A sustained rally from here would likely see Litecoin price rally to the 50-day EMA (purple) resistance near $78. Moreover, flipping the above immediate resistance level could help LTC price rise to the resistance near $85.
On the other hand, if prices continue to fall, Litecoin could end up invalidating the pattern, inviting more bearish sentiment and likely ending up at the support level near $69. Failure of the immediate support could force LTC price to test the support near $63.8 before recovering.
The RSI for LTC remained neutral, with a score of 41.86 on the daily charts.

Binance Executive’s Trial Resumes July 5 as Family Cites Health Is… | EVM News

Donald Trump Champions Bitcoin: Calls For Bitcoin As Strategic Reserve Asset | EVM News
Band Protocol Price Eyes 276% Jump As Bullish Wedge Pattern Emerge… | EVM News
-
 Latest News3 months ago
Crypto New Media Decrypt Warns Against $Decrypt Token Airdrop Scam | EVM News
-
 Latest News4 months ago
Ceτi AI Announces Successful Launch Of Revolutionary Decentralized AI Infrastructure Token | EVM News
-
Hot Projects4 months ago
Fetch AI Outshines in AI Token Dominated Gainers but This New AI A… | EVM News
-
 Latest News3 months ago
Japanese Telecom Companies Jump Into Crypto Sector, Plans To Launch Crypto Wallet | EVM News
-
 Latest News4 months ago
Bitcoin Dogs Sets A New Standard In Crypto Amidst Bitcoin Surge | EVM News
-
 Latest News1 month ago
Telegram Founder Receives Donations In Notcoin Worth $7 Million, Rising Appeal For New Memecoin | EVM News
-
 Latest News2 months ago
BC.GAME Secures New Curacao LOK License, Enhancing Legal Compliance And Global Reach | EVM News
-
 Hot Projects2 months ago
Dogecoin is Severely Underperforming New Memecoins This Year — Sho… | EVM News
