
Hot Projects
Alpha Transform Artificial Intelligence Index (AAI), Powered by th… | EVM News
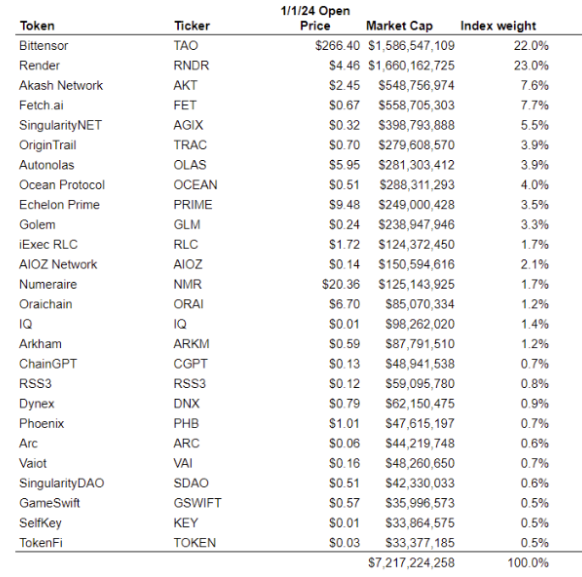
Alpha Transform Research, a leading blockchain research firm operating as an Alpha Transform Holdings’ subsidiary, today announced the release of the first performance metrics from its Alpha Transform Artificial Intelligence Index (AAI), which utilizes the brand new ERC-7621 Standard built by the Alvara Protocol. The index, launched at a base value of 100 on January 1, 2024, undergoes monthly rebalancing to maintain its relevance and accuracy.
AAI aims to be a benchmark for the crypto AI sector. The AAI measures the performance of leading AI tokens based on strict criteria and it features 20-30 tokens selected for their market capitalization, trading volume, and presence on reputable exchanges. For inclusion, tokens must have a $20 million minimum market cap, average daily trading volume over $500,000, and be listed on recognized Tier 1 or Tier 2 exchanges.
By the end of January, AAI had outpaced both equities and the broader crypto market, closing at 112.1, paced by Bittensor’s 76% return, attributed partly to Vitalik Buterin’s endorsement. For February, adjustments included new weights and the addition of four tokens, maintaining the index at 30 constituents.
“Much of the attention in early 2024 has gone toward the approval of BTC ETFs and the eventual rise of the BTC price itself to nearly all-time highs, but the AAI shows us that there might be even more reason to be bullish about the performance of key tokens tied to the emergent crypto AI sector” said Alpha Transform Holdings CEO Enzo Villani.
Utilizing the Ethereum blockchain, the Alvara ERC-7621 token standard that guides the AAI transcends the boundaries of both crypto and traditional finance, offering unparalleled flexibility and innovation for fund management. Under ERC-7621, every transaction and fund performance is visible to all, promoting trust, transparency, and merit-based management, allowing for instant diversification through pooling multiple crypto assets, while also reducing volatility.
About Alpha Transform Research
Active Investing in the Blockchain Economy.™
Alpha Transform Research is provided by Alpha Sigma Capital Advisors, LLC, the Investment Manager for the Alpha Blockchain/Web3 Fund and Alpha Liquid Fund. Alpha Sigma Capital (ASC) investment funds are focused on emerging blockchain companies that are successfully building their user-base, demonstrating real-world uses for their decentralized ecosystems, and moving blockchain technology towards mass-adoption. ASC is focused on companies leveraging blockchain technology to provide value-add in areas such as fintech, AI, supply chain, and healthcare. Apply to receive research at www.alphasigma.fund/research.
About Alpha Transform Holdings
Alpha Transform Holdings (ATH) is a digital asset organization dedicated to ushering in the future of blockchain-powered Web3. With our deep knowledge and expertise, we invest in and advise innovative companies and decentralized projects that leverage blockchain technology to revolutionize traditional industries such as financial services, healthcare, media & entertainment, and more. We work closely with portfolio companies to drive value while creating outsized returns and are renowned for our detailed research on growing blockchain initiatives. Our mission is simple: to accelerate the mass adoption of distributed ledger technology through investments that provide impactful solutions with long-term sustainability. Our vision is an open, connected world powered by secure decentralized systems so that everyone can benefit from the new tech economy.
Disclaimer
This is for informational use only. This is not investment advice. Other than disclosures relating to Alpha Transform Holdings (ATH) and Alpha Sigma Capital (ASC) this information is based on current public information that we consider reliable, but we do not represent it as accurate or complete, and it should not be relied on as such. The information, opinions, estimates, and forecasts contained herein are as of the date hereof and are subject to change without prior notification. We seek to update our information as appropriate.
Any forecasts contained herein are for illustrative purposes only and are not to be relied upon as advice or interpreted as a recommendation. The price of crypto assets may rise or fall because of changes in the broad market or changes in a company’s financial condition, sometimes rapidly or unpredictably. Past performance is not a guide to future performance, future returns are not guaranteed, and a loss of original capital may occur. Fluctuations in exchange rates could have adverse effects on the value or price of, or income derived from certain investments. We and our affiliates, officers, directors, and employees, excluding equity and credit analysts, will from time to time have long or short positions in, act as principal in, and buy or sell, the securities or derivatives, if any, referred to in this press release.
The information on which the information is based has been obtained from sources believed to be reliable such as, for example, the company’s financial statements filed with a regulator, the company website, the company white paper, pitchbook, and any other sources. While Alpha Sigma Capital has obtained data, statistics, and information from sources it believes to be reliable, Alpha Sigma Capital does not perform an audit or seek independent verification of any of the data, statistics, and information it receives.
Unless otherwise provided in a separate agreement, Alpha Sigma Capital does not represent that the contents meet all of the presentation and/or disclosure standards applicable in the jurisdiction the recipient is located. Alpha Sigma Capital and its officers, directors, and employees shall not be responsible or liable for any trading decisions, damages, or other losses resulting from, or related to, the information, data, analyses, or opinions within the report.
Crypto and/or digital currencies involve substantial risk, are speculative in nature, and may not perform as expected. Many digital currency platforms are not subject to regulatory supervision, unlike regulated exchanges. Some platforms may commingle customer assets in shared accounts and provide inadequate custody, which may affect whether or how investors can withdraw their currency and/or subject them to money laundering. Digital currencies may be vulnerable to hacks and cyber fraud as well as significant volatility and price swings.
![]()

NOIDA (CoinChapter.com)—Band Protocol (BAND) made significant advances in the crypto sector, and recent developments highlight the project’s commitment to expanding.
Unconfirmed social media posts suggest that Synthetix could be working on integrating Band Protocol. If true, partnership news could help BAND price confirm a bullish technical pattern.
BAND Price Formed Bullish Pattern
The Band Protocol token formed a bullish technical pattern called the ‘falling wedge.’
Bullish news, such as Bond Protocol’s making a new partnership or integrating with other projects, could help the project’s token confirm the pattern.
A falling wedge pattern features a pair of converging trend lines connecting lower highs and lower lows, forming a narrowing shape that slopes downward.
The pattern typically suggests that an asset’s price, while consolidating in a downtrend, is losing bearish momentum and preparing for a potential reversal to the upside. Typically, a breakout occurs in the direction of the overall trend, which, for a falling wedge, is upward.
To estimate the price target of a falling wedge pattern, traders measure the widest part of the wedge at the beginning of the formation. They then project this distance upward from the breakout point to set a potential target.
An accompanying increase in trading volume can further confirm the reliability of the breakout. Higher volume during the breakout suggests stronger market conviction, supporting the likelihood of a successful price reversal.
According to the rules of technical analysis, the Band Protocol token price could rally over 276% to reach the pattern’s theoretical price target near $4.6.
It is unlikely the token would rally to the projected price target immediately after confirming the pattern, but breaking out of the wedge setup could attract more buying pressure, helping the token continue its rally till profit booking puts the brakes on the run.
BAND Bulls Struggling With 20-Day EMA
BAND price climbed above its 20-day EMA (red wave) dynamic resistance as the token entered July. However, July 3’s nearly 6% drop forced the token’s price back below the EMA resistance, suggesting bears aggressively defend the supply zone near the 20-day EMA.

Bulls have their task cut out, with the token starting July 4 with minor gains. Flipping the EMA resistance with good volumes would certainly help the BAND price’s cause, helping the token rally to the resistance near $1.34.
A break above immediate resistance might see the Band Protocol token’s price target the 100-day EMA (blue wave) resistance near $1.5.
On the other hand, if BAND price fails to rally, the token could drop to the support levels near $1.14 and $1.05 before recovering.
The RSI for BAND remained neutral, with a score of 45.56 on the daily charts.

NOIDA (CoinChapter.com)— Litecoin price ended June down by nearly 10%, and so far, July has not been very kind to the blockchain platform. LTC bulls have failed to convert a recent surge in network activity into a bullish cue for the token.
However, a technical setup might help avoid LTC price more bloodshed, if the bulls manage to avoid invalidating the pattern.
Litecoin Price Testing Support Of Bullish Setup
The Litecoin token’s price has formed a bullish technical setup called the ‘ascending triangle.‘
The token’s price are currently testing the ascending trendline of the pattern. A rebound from here could infuse confidence in the token’s rally, attracting more buyers expecting a bullish breakout.
Under technical analysis, an ascending triangle pattern emerges when a horizontal trendline connects swing highs and an ascending trendline connects swing lows. The pattern indicates a consolidation period where the buyers gradually gain strength against a consistent level of resistance.
Volume analysis is critical, as it helps to validate the breakout’s strength. Typically, as the price action approaches the triangle’s apex, the volume tends to decrease, reflecting a period of reduced trading activity and uncertainty.
When the trendlines converge, creating a narrowing price range, buyers often enter the market in anticipation of a breakout. Ideally, the breakout occurs above the horizontal resistance line, accompanied by a significant increase in trading volume.
The surge in volume is a key indicator that the breakout is robust and likely to sustain.
According to the rules of technical analysis, the price target for a breakout is equal to the triangle’s height at its thickest point. If the bullish pattern pans out, the theoretical price target for LINK is near $269.5, a spike of 267% from current levels.
LTC price Fails To Conquer EMA Resistance
Litecoin price has failed to move above the 20-day EMA (red wave) dynamic resistance since June 8, with prices dropping nearly 6% to a daily low near $72 on July 3. The downtrend suggests bears are booking profits near $72.

A sustained rally from here would likely see Litecoin price rally to the 50-day EMA (purple) resistance near $78. Moreover, flipping the above immediate resistance level could help LTC price rise to the resistance near $85.
On the other hand, if prices continue to fall, Litecoin could end up invalidating the pattern, inviting more bearish sentiment and likely ending up at the support level near $69. Failure of the immediate support could force LTC price to test the support near $63.8 before recovering.
The RSI for LTC remained neutral, with a score of 41.86 on the daily charts.

NAIROBI (CoinChapter.com)—Thanks to some recent developments, the rivalry between Ethereum and Solana has intensified. Ethereum remains a powerhouse in the Layer 1 blockchain sector and DeFi, but Solana is gaining traction with significant economic activity and growing market share.
CoinMarketCap data shows Ethereum commanding 62% of the $695 billion market cap in the smart contract space. The network also dominates revenue, securing 70% of Layer 1 income. Ethereum’s stronghold extends to the DeFi sector, with Ethereum doubling its total value locked (TVL) since the start of the year.
BNB Chain follows with $85 billion in the smart contract space, while Solana holds $59 billion. In terms of DeFi TVL, BNB Chain contributed $5 billion in the second quarter, and Solana contributed $4 billion.
Solana Gains Traction, but Ethereum Holds Strong
While Solana shows growth in certain metrics, Ether remains the dominant force. Mert Mumtaz, CEO of Helius Labs, noted that Solana’s economic activity surpasses Ethereum at times, driven by higher MEV and priority fees.
According to DefiLlama, despite Solana’s growth, Ethereum’s DeFi TVL stands at $57.36 billion, compared to Solana’s $4.5 billion. Tron and BNB Chain occupy the middle ground with $7.7 billion and $4.8 billion, respectively. Ethereum’s continued dominance in the Layer 1 sector, despite the rise of Layer 2 solutions, highlights the blockchain’s demand.

Ryan Connor, a researcher at Blockworks, posted on X about the strengthening case for the SOLETH relative value trade. Connor noted Ethereum’s market cap and price-to-sales ratio are near cycle highs, while Solana’s price-to-sales ratio is at all-time lows.
He emphasized Ethereum’s revenue decline and Solana’s growing market share and revenue, raising questions for traditional finance (TradFi) investors about Ethereum’s valuation.

Ethereum’s trailing 1-month price-to-sales (P/S) ratio fluctuated significantly, reaching a recent level of around 220, whereas Solana’s dropped to 67. Furthermore, Solana’s blockspace profitability has seen a sharp rise, reaching nearly $80 million in emissions.
In contrast, Ethereum’s blockspace profitability peaked at around $2 billion in mid-2021 but has since stabilized.

Additionally, the t30d DEX volume market share chart shows ether holding a majority share, although Solana has been increasing its presence, now capturing around 30%. Though the data supports the narrative of Solana’s growing influence, it also emphasizes Ethereum’s sustained leadership.
SOL & ETH Price Performance and Market Outlook
Price performance data reveals significant insights. As of July 3, 2024, Ethereum is priced near $3,280, experiencing a 5% decline in the past 24 hours and a nearly 3% decrease over the past seven days. Ethereum’s market cap stands at $395.8 billion, with a trading volume of $10.4 billion.
Solana is priced around $142, reflecting a 5.68% decrease in the past 24 hours but a 3.68% increase over the past seven days. This price increase aligns with Solana’s rising market activity, while Ethereum’s relative stability reflects its entrenched market dominance.


Donald Trump Champions Bitcoin: Calls For Bitcoin As Strategic Reserve Asset | EVM News
Band Protocol Price Eyes 276% Jump As Bullish Wedge Pattern Emerge… | EVM News
Litecoin Price Tests Critical Support: Will the Bulls Prevail? | EVM News
-
 Latest News3 months ago
Crypto New Media Decrypt Warns Against $Decrypt Token Airdrop Scam | EVM News
-
 Latest News4 months ago
Ceτi AI Announces Successful Launch Of Revolutionary Decentralized AI Infrastructure Token | EVM News
-
Hot Projects4 months ago
Fetch AI Outshines in AI Token Dominated Gainers but This New AI A… | EVM News
-
 Latest News3 months ago
Japanese Telecom Companies Jump Into Crypto Sector, Plans To Launch Crypto Wallet | EVM News
-
 Latest News4 months ago
Bitcoin Dogs Sets A New Standard In Crypto Amidst Bitcoin Surge | EVM News
-
 Latest News1 month ago
Telegram Founder Receives Donations In Notcoin Worth $7 Million, Rising Appeal For New Memecoin | EVM News
-
 Latest News2 months ago
BC.GAME Secures New Curacao LOK License, Enhancing Legal Compliance And Global Reach | EVM News
-
 Hot Projects2 months ago
Dogecoin is Severely Underperforming New Memecoins This Year — Sho… | EVM News
