
Hot Projects
Lucid Stock Prediction For 2025 — What to Expect? | EVM News
LUCKNOW (CoinChapter.com) — Electric vehicle manufacturer Lucid Group has ambitious plans to take on automotive titans like Tesla. However, with high inflation persisting, can this fledgling company realistically compete over the next few years? Go through the following to find the Lucid stock price prediction for 2025.
On the one hand, Lucid has the backing of heavyweight investors like Saudi Arabia’s Public Investment Fund and BlackRock. The former recently bought an additional 200 million LCID shares, giving it a 62% stake in Lucid. Meanwhile, BlackRock owns over 31 million shares as of December 2022. With such big-money believers, Lucid seems poised for potential growth.
However, Lucid’s vehicles remain expensive even after the company funded $7,500 credits on some models. The entry-level Air Touring still costs $107,400, while the Air Grand Touring begins at $138,000. Compared to Tesla and Ford’s recent EV price cuts, Lucid’s sticker prices could deter buyers, even ultra-high-net-worth individuals facing recession fears.
Considering the challenges of competing in a crowded EV space amidst economic uncertainty, experts predict closing Lucid (LCID) stock price to be around $15 in 2025. That would represent a reasonable return for early investors. However, Lucid will likely remain a niche automaker compared to segment leaders like Tesla in the next few years.
Lucid stock Price Prediction 2025 and 2030
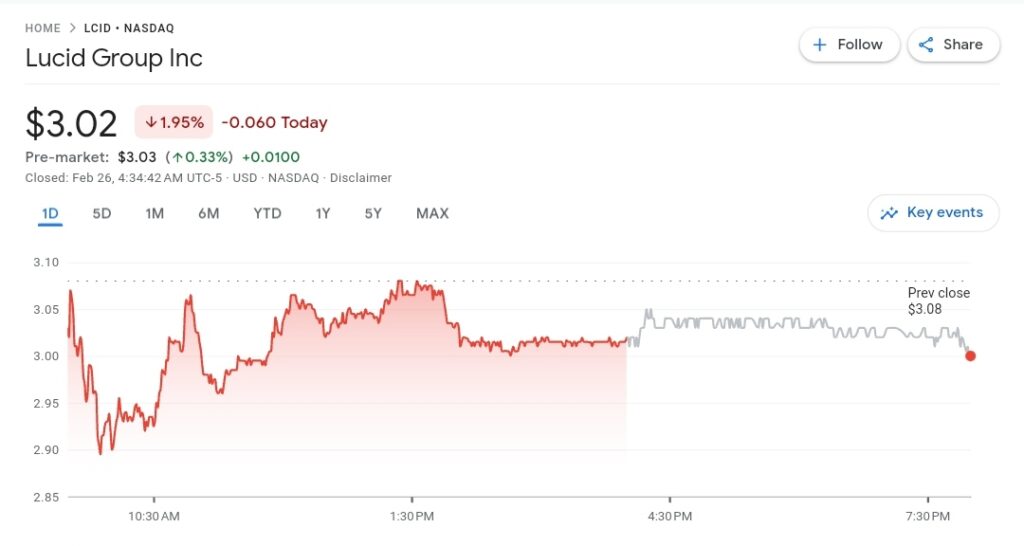
As of March 6, LCID was trading for $3.02. Recent price predictions of Lucid (LCID) stock show that the price will drop to $2.39 by the month’s end, representing a 33% decrease from current levels. This bearish outlook is based on technical indicators showing high fear levels in the market. Over the past month, LCID has seen volatile 10%+ price swings and a 40% ratio of up days versus down days.
Given that the stock is trading above forecasted near-term valuations, the risky outlook suggests that now may not be an opportune time to buy LCID. However, long-term growth predictions remain more favorable.
Based on averaging 10-year growth trends, our Lucid price prediction sees LCID shares reaching $4.09 by early 2025. That would signify a 35% upside from the current stock price. More optimistic models predict shares climbing as high as $7.93 in 2025, contingent on sustainable sales and interest momentum.
If robust momentum persists, LCID could reach $18.59 per share by 2030. That scenario would translate to a 500%+ return versus today’s valuation. Nonetheless, near-term challenges underscore the speculative nature of LCID as a higher-risk, high-reward electric vehicle play over the next few pivotal years.
Frequently Asked Questions (FAQ)
LCID shares could drop to $2.39 in the short term by March 2024, per bearish indicators pointing to high volatility and investor fear. However, long-term growth predictions remain brighter. Based on a 10-year average, forecasts call for 2025 prices to be around $4.09 (35% upside) and 2030 prices to approach $18.59 (500%+ upside).
It is highly unlikely LCID will reach $100 per share, barring massive 3,200%+ gains. The most optimistic forecast sees prices potentially hitting $12.10 by late 2024.
Like any stock, LCID responds to supply/demand dynamics influenced by fundamentals (e.g., earnings, products), market sentiment, economic factors, interest rates, and geopolitics. Technical indicators and chart patterns also provide clues into bullish/bearish momentum.
According to growth forecasts, LCID could present a good long-term investment opportunity. However, its speculative nature and near-term headwinds also highlight elevation risk. When evaluating LCID, it is best to assess your risk tolerance and investment timeline.
Based on historical growth rates, LCID may reach $4.09 in 2025 (35% upside) and $18.59 in 2030 (500%+ upside). However, these long-term predictions come with significant uncertainty. Careful due diligence is warranted before investing in this high-risk, high-reward EV startup story.
Key tools traders use to forecast LCID price action include technical indicators like moving averages and Fibonacci levels and candlestick chart patterns signaling bullish or bearish momentum.

NOIDA (CoinChapter.com)—Band Protocol (BAND) made significant advances in the crypto sector, and recent developments highlight the project’s commitment to expanding.
Unconfirmed social media posts suggest that Synthetix could be working on integrating Band Protocol. If true, partnership news could help BAND price confirm a bullish technical pattern.
BAND Price Formed Bullish Pattern
The Band Protocol token formed a bullish technical pattern called the ‘falling wedge.’
Bullish news, such as Bond Protocol’s making a new partnership or integrating with other projects, could help the project’s token confirm the pattern.
A falling wedge pattern features a pair of converging trend lines connecting lower highs and lower lows, forming a narrowing shape that slopes downward.
The pattern typically suggests that an asset’s price, while consolidating in a downtrend, is losing bearish momentum and preparing for a potential reversal to the upside. Typically, a breakout occurs in the direction of the overall trend, which, for a falling wedge, is upward.
To estimate the price target of a falling wedge pattern, traders measure the widest part of the wedge at the beginning of the formation. They then project this distance upward from the breakout point to set a potential target.
An accompanying increase in trading volume can further confirm the reliability of the breakout. Higher volume during the breakout suggests stronger market conviction, supporting the likelihood of a successful price reversal.
According to the rules of technical analysis, the Band Protocol token price could rally over 276% to reach the pattern’s theoretical price target near $4.6.
It is unlikely the token would rally to the projected price target immediately after confirming the pattern, but breaking out of the wedge setup could attract more buying pressure, helping the token continue its rally till profit booking puts the brakes on the run.
BAND Bulls Struggling With 20-Day EMA
BAND price climbed above its 20-day EMA (red wave) dynamic resistance as the token entered July. However, July 3’s nearly 6% drop forced the token’s price back below the EMA resistance, suggesting bears aggressively defend the supply zone near the 20-day EMA.

Bulls have their task cut out, with the token starting July 4 with minor gains. Flipping the EMA resistance with good volumes would certainly help the BAND price’s cause, helping the token rally to the resistance near $1.34.
A break above immediate resistance might see the Band Protocol token’s price target the 100-day EMA (blue wave) resistance near $1.5.
On the other hand, if BAND price fails to rally, the token could drop to the support levels near $1.14 and $1.05 before recovering.
The RSI for BAND remained neutral, with a score of 45.56 on the daily charts.

NOIDA (CoinChapter.com)— Litecoin price ended June down by nearly 10%, and so far, July has not been very kind to the blockchain platform. LTC bulls have failed to convert a recent surge in network activity into a bullish cue for the token.
However, a technical setup might help avoid LTC price more bloodshed, if the bulls manage to avoid invalidating the pattern.
Litecoin Price Testing Support Of Bullish Setup
The Litecoin token’s price has formed a bullish technical setup called the ‘ascending triangle.‘
The token’s price are currently testing the ascending trendline of the pattern. A rebound from here could infuse confidence in the token’s rally, attracting more buyers expecting a bullish breakout.
Under technical analysis, an ascending triangle pattern emerges when a horizontal trendline connects swing highs and an ascending trendline connects swing lows. The pattern indicates a consolidation period where the buyers gradually gain strength against a consistent level of resistance.
Volume analysis is critical, as it helps to validate the breakout’s strength. Typically, as the price action approaches the triangle’s apex, the volume tends to decrease, reflecting a period of reduced trading activity and uncertainty.
When the trendlines converge, creating a narrowing price range, buyers often enter the market in anticipation of a breakout. Ideally, the breakout occurs above the horizontal resistance line, accompanied by a significant increase in trading volume.
The surge in volume is a key indicator that the breakout is robust and likely to sustain.
According to the rules of technical analysis, the price target for a breakout is equal to the triangle’s height at its thickest point. If the bullish pattern pans out, the theoretical price target for LINK is near $269.5, a spike of 267% from current levels.
LTC price Fails To Conquer EMA Resistance
Litecoin price has failed to move above the 20-day EMA (red wave) dynamic resistance since June 8, with prices dropping nearly 6% to a daily low near $72 on July 3. The downtrend suggests bears are booking profits near $72.

A sustained rally from here would likely see Litecoin price rally to the 50-day EMA (purple) resistance near $78. Moreover, flipping the above immediate resistance level could help LTC price rise to the resistance near $85.
On the other hand, if prices continue to fall, Litecoin could end up invalidating the pattern, inviting more bearish sentiment and likely ending up at the support level near $69. Failure of the immediate support could force LTC price to test the support near $63.8 before recovering.
The RSI for LTC remained neutral, with a score of 41.86 on the daily charts.

NAIROBI (CoinChapter.com)—Thanks to some recent developments, the rivalry between Ethereum and Solana has intensified. Ethereum remains a powerhouse in the Layer 1 blockchain sector and DeFi, but Solana is gaining traction with significant economic activity and growing market share.
CoinMarketCap data shows Ethereum commanding 62% of the $695 billion market cap in the smart contract space. The network also dominates revenue, securing 70% of Layer 1 income. Ethereum’s stronghold extends to the DeFi sector, with Ethereum doubling its total value locked (TVL) since the start of the year.
BNB Chain follows with $85 billion in the smart contract space, while Solana holds $59 billion. In terms of DeFi TVL, BNB Chain contributed $5 billion in the second quarter, and Solana contributed $4 billion.
Solana Gains Traction, but Ethereum Holds Strong
While Solana shows growth in certain metrics, Ether remains the dominant force. Mert Mumtaz, CEO of Helius Labs, noted that Solana’s economic activity surpasses Ethereum at times, driven by higher MEV and priority fees.
According to DefiLlama, despite Solana’s growth, Ethereum’s DeFi TVL stands at $57.36 billion, compared to Solana’s $4.5 billion. Tron and BNB Chain occupy the middle ground with $7.7 billion and $4.8 billion, respectively. Ethereum’s continued dominance in the Layer 1 sector, despite the rise of Layer 2 solutions, highlights the blockchain’s demand.

Ryan Connor, a researcher at Blockworks, posted on X about the strengthening case for the SOLETH relative value trade. Connor noted Ethereum’s market cap and price-to-sales ratio are near cycle highs, while Solana’s price-to-sales ratio is at all-time lows.
He emphasized Ethereum’s revenue decline and Solana’s growing market share and revenue, raising questions for traditional finance (TradFi) investors about Ethereum’s valuation.

Ethereum’s trailing 1-month price-to-sales (P/S) ratio fluctuated significantly, reaching a recent level of around 220, whereas Solana’s dropped to 67. Furthermore, Solana’s blockspace profitability has seen a sharp rise, reaching nearly $80 million in emissions.
In contrast, Ethereum’s blockspace profitability peaked at around $2 billion in mid-2021 but has since stabilized.

Additionally, the t30d DEX volume market share chart shows ether holding a majority share, although Solana has been increasing its presence, now capturing around 30%. Though the data supports the narrative of Solana’s growing influence, it also emphasizes Ethereum’s sustained leadership.
SOL & ETH Price Performance and Market Outlook
Price performance data reveals significant insights. As of July 3, 2024, Ethereum is priced near $3,280, experiencing a 5% decline in the past 24 hours and a nearly 3% decrease over the past seven days. Ethereum’s market cap stands at $395.8 billion, with a trading volume of $10.4 billion.
Solana is priced around $142, reflecting a 5.68% decrease in the past 24 hours but a 3.68% increase over the past seven days. This price increase aligns with Solana’s rising market activity, while Ethereum’s relative stability reflects its entrenched market dominance.


Donald Trump Champions Bitcoin: Calls For Bitcoin As Strategic Reserve Asset | EVM News
Band Protocol Price Eyes 276% Jump As Bullish Wedge Pattern Emerge… | EVM News
Litecoin Price Tests Critical Support: Will the Bulls Prevail? | EVM News
-
 Latest News3 months ago
Crypto New Media Decrypt Warns Against $Decrypt Token Airdrop Scam | EVM News
-
 Latest News4 months ago
Ceτi AI Announces Successful Launch Of Revolutionary Decentralized AI Infrastructure Token | EVM News
-
Hot Projects4 months ago
Fetch AI Outshines in AI Token Dominated Gainers but This New AI A… | EVM News
-
 Latest News3 months ago
Japanese Telecom Companies Jump Into Crypto Sector, Plans To Launch Crypto Wallet | EVM News
-
 Latest News4 months ago
Bitcoin Dogs Sets A New Standard In Crypto Amidst Bitcoin Surge | EVM News
-
 Latest News1 month ago
Telegram Founder Receives Donations In Notcoin Worth $7 Million, Rising Appeal For New Memecoin | EVM News
-
 Latest News2 months ago
BC.GAME Secures New Curacao LOK License, Enhancing Legal Compliance And Global Reach | EVM News
-
 Hot Projects2 months ago
Dogecoin is Severely Underperforming New Memecoins This Year — Sho… | EVM News
