
Hot Projects
Web3-Friendly Lampu Festival in Bali Uses NFT Tickets and Crypto P… | EVM News

Key Takeaways:
- Web3-Friendly Lampu festival used NFT ticketing for secure entry, reducing fraud.
- Payment options included traditional methods and USD Coin (USDC).
- Belong provided a branded platform with event schedules and real-time updates.
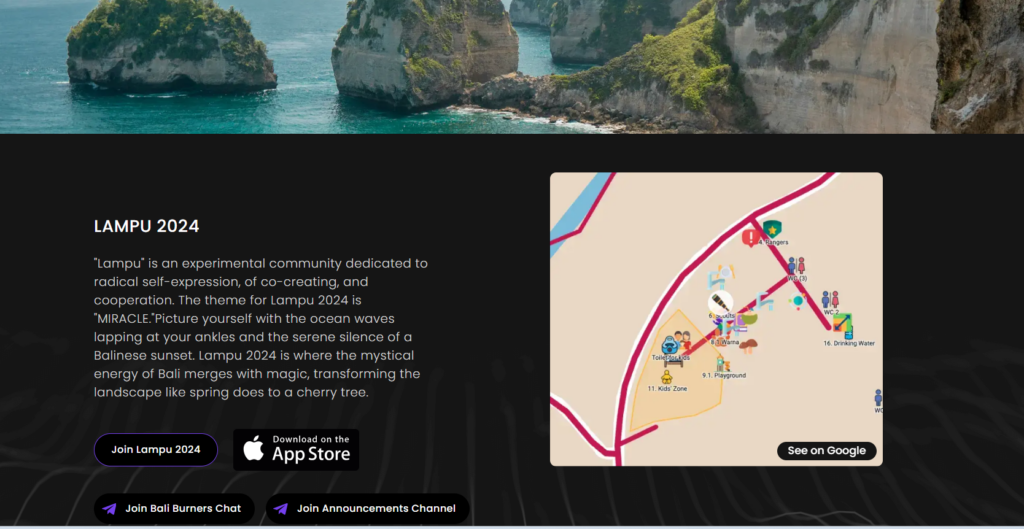
YEREVAN (CoinChapter.com) — The Lampu festival in Bali, inspired by the world-famous Burning Man, integrated Web3 technologies for its 2024 event. Held from Feb. 29 to March 3, the festival welcomed over 1,000 attendees who experienced NFT ticketing and crypto payments.
Lampu Festival Implements NFT Ticketing for Secure Entry
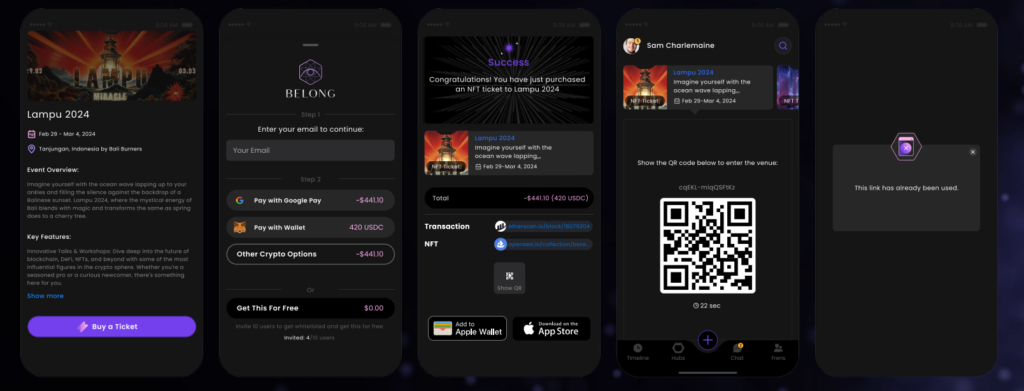
NFT ticketing was a feature of the Lampu festival. Each ticket, a unique digital asset stored on a blockchain, ensured authenticity and ownership. This method reduced fraud and improved operations for the organizers. Unlike traditional tickets, NFT tickets provided a secure method of entry, eliminating the risks of counterfeiting or loss.
Belong’s platform offered multiple ticket price tiers. After successful payment, users received their tickets in NFT form. The transaction ID was available on Etherscan, and the NFT was visible on the OpenSea platform. Gasless minting allowed payments with USDC without needing other cryptocurrencies like Polygon (MATIC) or Ether (ETH). Festivalgoers then scanned their QR code on the same platform to enter the event.
Jay, Belong’s founder, stated,
“Our goal is not only to provide software but also to enhance engagement and create meaningful connections within communities.”
Payment Options at Lampu Festival
The festival’s payment options included both traditional methods and USD Coin (USDC), a stablecoin pegged to the U.S. dollar. Community owners received payments in USDC, simplifying the financial transactions.
Visitors to the Lampu festival could choose from Apple Pay, Google Pay, and Web3 wallets, providing a variety of payment options to suit different preferences. This flexibility ensured that both tech-savvy attendees and those less familiar with cryptocurrency could easily participate.
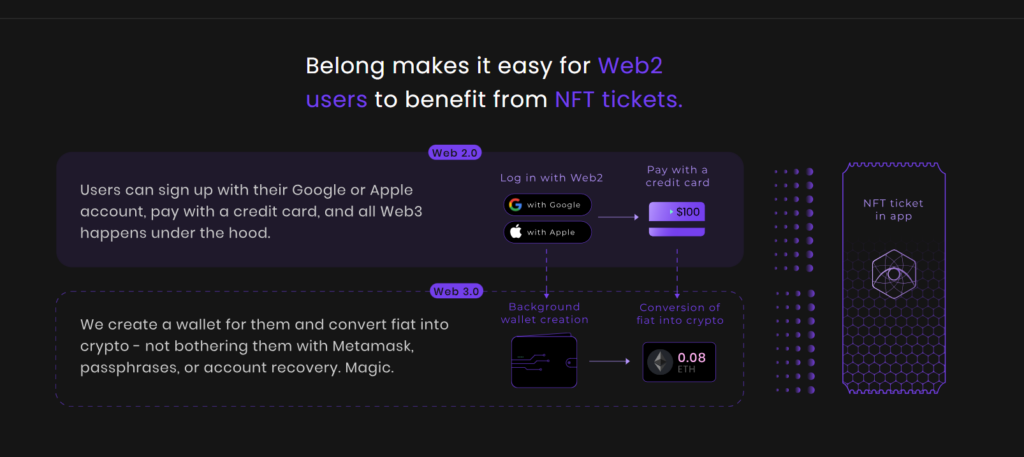
Belong’s platform developed a Lampu-branded landing page for the event. This page included event schedules, community links, and real-time updates. It was designed to be accessible to a diverse audience, including those unfamiliar with Web3 technologies.

NOIDA (CoinChapter.com)—Band Protocol (BAND) made significant advances in the crypto sector, and recent developments highlight the project’s commitment to expanding.
Unconfirmed social media posts suggest that Synthetix could be working on integrating Band Protocol. If true, partnership news could help BAND price confirm a bullish technical pattern.
BAND Price Formed Bullish Pattern
The Band Protocol token formed a bullish technical pattern called the ‘falling wedge.’
Bullish news, such as Bond Protocol’s making a new partnership or integrating with other projects, could help the project’s token confirm the pattern.
A falling wedge pattern features a pair of converging trend lines connecting lower highs and lower lows, forming a narrowing shape that slopes downward.
The pattern typically suggests that an asset’s price, while consolidating in a downtrend, is losing bearish momentum and preparing for a potential reversal to the upside. Typically, a breakout occurs in the direction of the overall trend, which, for a falling wedge, is upward.
To estimate the price target of a falling wedge pattern, traders measure the widest part of the wedge at the beginning of the formation. They then project this distance upward from the breakout point to set a potential target.
An accompanying increase in trading volume can further confirm the reliability of the breakout. Higher volume during the breakout suggests stronger market conviction, supporting the likelihood of a successful price reversal.
According to the rules of technical analysis, the Band Protocol token price could rally over 276% to reach the pattern’s theoretical price target near $4.6.
It is unlikely the token would rally to the projected price target immediately after confirming the pattern, but breaking out of the wedge setup could attract more buying pressure, helping the token continue its rally till profit booking puts the brakes on the run.
BAND Bulls Struggling With 20-Day EMA
BAND price climbed above its 20-day EMA (red wave) dynamic resistance as the token entered July. However, July 3’s nearly 6% drop forced the token’s price back below the EMA resistance, suggesting bears aggressively defend the supply zone near the 20-day EMA.

Bulls have their task cut out, with the token starting July 4 with minor gains. Flipping the EMA resistance with good volumes would certainly help the BAND price’s cause, helping the token rally to the resistance near $1.34.
A break above immediate resistance might see the Band Protocol token’s price target the 100-day EMA (blue wave) resistance near $1.5.
On the other hand, if BAND price fails to rally, the token could drop to the support levels near $1.14 and $1.05 before recovering.
The RSI for BAND remained neutral, with a score of 45.56 on the daily charts.

NOIDA (CoinChapter.com)— Litecoin price ended June down by nearly 10%, and so far, July has not been very kind to the blockchain platform. LTC bulls have failed to convert a recent surge in network activity into a bullish cue for the token.
However, a technical setup might help avoid LTC price more bloodshed, if the bulls manage to avoid invalidating the pattern.
Litecoin Price Testing Support Of Bullish Setup
The Litecoin token’s price has formed a bullish technical setup called the ‘ascending triangle.‘
The token’s price are currently testing the ascending trendline of the pattern. A rebound from here could infuse confidence in the token’s rally, attracting more buyers expecting a bullish breakout.
Under technical analysis, an ascending triangle pattern emerges when a horizontal trendline connects swing highs and an ascending trendline connects swing lows. The pattern indicates a consolidation period where the buyers gradually gain strength against a consistent level of resistance.
Volume analysis is critical, as it helps to validate the breakout’s strength. Typically, as the price action approaches the triangle’s apex, the volume tends to decrease, reflecting a period of reduced trading activity and uncertainty.
When the trendlines converge, creating a narrowing price range, buyers often enter the market in anticipation of a breakout. Ideally, the breakout occurs above the horizontal resistance line, accompanied by a significant increase in trading volume.
The surge in volume is a key indicator that the breakout is robust and likely to sustain.
According to the rules of technical analysis, the price target for a breakout is equal to the triangle’s height at its thickest point. If the bullish pattern pans out, the theoretical price target for LINK is near $269.5, a spike of 267% from current levels.
LTC price Fails To Conquer EMA Resistance
Litecoin price has failed to move above the 20-day EMA (red wave) dynamic resistance since June 8, with prices dropping nearly 6% to a daily low near $72 on July 3. The downtrend suggests bears are booking profits near $72.

A sustained rally from here would likely see Litecoin price rally to the 50-day EMA (purple) resistance near $78. Moreover, flipping the above immediate resistance level could help LTC price rise to the resistance near $85.
On the other hand, if prices continue to fall, Litecoin could end up invalidating the pattern, inviting more bearish sentiment and likely ending up at the support level near $69. Failure of the immediate support could force LTC price to test the support near $63.8 before recovering.
The RSI for LTC remained neutral, with a score of 41.86 on the daily charts.

NAIROBI (CoinChapter.com)—Thanks to some recent developments, the rivalry between Ethereum and Solana has intensified. Ethereum remains a powerhouse in the Layer 1 blockchain sector and DeFi, but Solana is gaining traction with significant economic activity and growing market share.
CoinMarketCap data shows Ethereum commanding 62% of the $695 billion market cap in the smart contract space. The network also dominates revenue, securing 70% of Layer 1 income. Ethereum’s stronghold extends to the DeFi sector, with Ethereum doubling its total value locked (TVL) since the start of the year.
BNB Chain follows with $85 billion in the smart contract space, while Solana holds $59 billion. In terms of DeFi TVL, BNB Chain contributed $5 billion in the second quarter, and Solana contributed $4 billion.
Solana Gains Traction, but Ethereum Holds Strong
While Solana shows growth in certain metrics, Ether remains the dominant force. Mert Mumtaz, CEO of Helius Labs, noted that Solana’s economic activity surpasses Ethereum at times, driven by higher MEV and priority fees.
According to DefiLlama, despite Solana’s growth, Ethereum’s DeFi TVL stands at $57.36 billion, compared to Solana’s $4.5 billion. Tron and BNB Chain occupy the middle ground with $7.7 billion and $4.8 billion, respectively. Ethereum’s continued dominance in the Layer 1 sector, despite the rise of Layer 2 solutions, highlights the blockchain’s demand.

Ryan Connor, a researcher at Blockworks, posted on X about the strengthening case for the SOLETH relative value trade. Connor noted Ethereum’s market cap and price-to-sales ratio are near cycle highs, while Solana’s price-to-sales ratio is at all-time lows.
He emphasized Ethereum’s revenue decline and Solana’s growing market share and revenue, raising questions for traditional finance (TradFi) investors about Ethereum’s valuation.

Ethereum’s trailing 1-month price-to-sales (P/S) ratio fluctuated significantly, reaching a recent level of around 220, whereas Solana’s dropped to 67. Furthermore, Solana’s blockspace profitability has seen a sharp rise, reaching nearly $80 million in emissions.
In contrast, Ethereum’s blockspace profitability peaked at around $2 billion in mid-2021 but has since stabilized.

Additionally, the t30d DEX volume market share chart shows ether holding a majority share, although Solana has been increasing its presence, now capturing around 30%. Though the data supports the narrative of Solana’s growing influence, it also emphasizes Ethereum’s sustained leadership.
SOL & ETH Price Performance and Market Outlook
Price performance data reveals significant insights. As of July 3, 2024, Ethereum is priced near $3,280, experiencing a 5% decline in the past 24 hours and a nearly 3% decrease over the past seven days. Ethereum’s market cap stands at $395.8 billion, with a trading volume of $10.4 billion.
Solana is priced around $142, reflecting a 5.68% decrease in the past 24 hours but a 3.68% increase over the past seven days. This price increase aligns with Solana’s rising market activity, while Ethereum’s relative stability reflects its entrenched market dominance.


Donald Trump Champions Bitcoin: Calls For Bitcoin As Strategic Reserve Asset | EVM News
Band Protocol Price Eyes 276% Jump As Bullish Wedge Pattern Emerge… | EVM News
Litecoin Price Tests Critical Support: Will the Bulls Prevail? | EVM News
-
 Latest News3 months ago
Crypto New Media Decrypt Warns Against $Decrypt Token Airdrop Scam | EVM News
-
 Latest News4 months ago
Ceτi AI Announces Successful Launch Of Revolutionary Decentralized AI Infrastructure Token | EVM News
-
Hot Projects4 months ago
Fetch AI Outshines in AI Token Dominated Gainers but This New AI A… | EVM News
-
 Latest News3 months ago
Japanese Telecom Companies Jump Into Crypto Sector, Plans To Launch Crypto Wallet | EVM News
-
 Latest News4 months ago
Bitcoin Dogs Sets A New Standard In Crypto Amidst Bitcoin Surge | EVM News
-
 Latest News1 month ago
Telegram Founder Receives Donations In Notcoin Worth $7 Million, Rising Appeal For New Memecoin | EVM News
-
 Latest News2 months ago
BC.GAME Secures New Curacao LOK License, Enhancing Legal Compliance And Global Reach | EVM News
-
 Hot Projects2 months ago
Dogecoin is Severely Underperforming New Memecoins This Year — Sho… | EVM News
