Hot Projects
Toncoin Price Defies Market Slump Amid Rising Wedge Concerns | EVM News

NOIDA (CoinChapter.com)— Price of The Open Network’s native token, Toncoin, defied the wider crypto market downtrend, with bulls recovering most of the token’s 7.5% loss on June 24.
Unlike the major crypto tokens like Bitcoin (BTC), etc., which have been trading downward over the past seven days, TON prices rose by over 11% since June 18 to reach a daily high of nearly $7.6 on June 24.
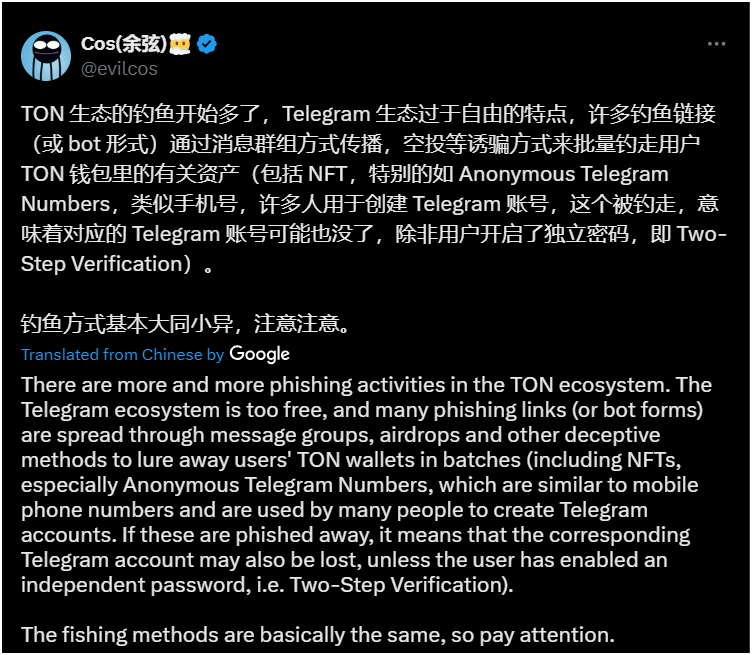
The recent phishing attacks on TONCOIN, involving fake websites and social media scams, have led to significant user losses and heightened security concerns. Individual losses ranged from 100 to over 10,000 TONCOIN, shaking the community’s trust.
Blockchain security firm Slow Mist’s founder warned the Toncoin community of phishing scams plaguing the ecosystem.
The TON Foundation’s efforts to combat these threats, including enhanced security measures and user education, are ongoing. However, the negative sentiment from these incidents could create bearish pressure on TONCOIN’s market performance.
TON Price Moving Inside Bearish Pattern
The Toncoin token price has formed a bearish pattern called the ‘rising wedge.’

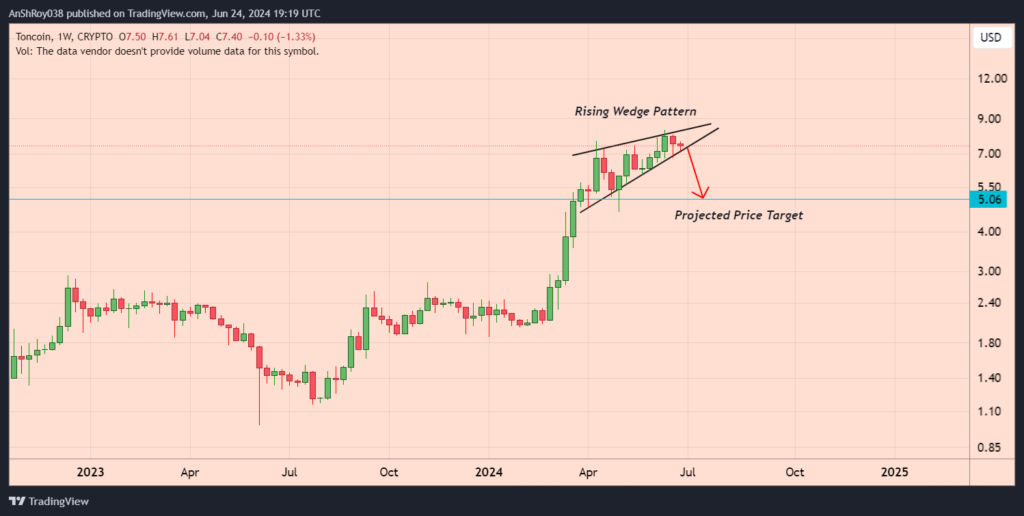
The rising wedge pattern signals a potential reversal in the current trend. Identified by two upward-sloping lines converging towards each other, the resistance line ascends at a gentler slope than the support line.
This pattern forms during an upward trend with a series of higher highs and higher lows, indicating reduced buying momentum. As the wedge progresses, the distance between the resistance and support lines decreases, showing weakening momentum.
Typically, the rising wedge leads to a downward breakout. The price breaks below the support line, often with increased trading volume, signaling strong selling pressure.
Traders calculate the price target for the pattern by measuring the vertical distance between the initial high and low points of the wedge and subtracting this from the breakout point.
Per the rules of technical analysis, if the Toncoin price breaks below the bearish pattern, the token might fall to the theoretical price target near $5, a drop of over 32% from current levels.
Toncoin Price Holds Above $7 Support
Despite the bearish cues, TON price held above $7 on June 24 after the bulls led a late recovery.
If TON price starts a rally from here, the token would likely rise to the resistance near $7.6. Flipping the immediate resistance might help Toncoin price target the 0.786 FIB resistance near $8.

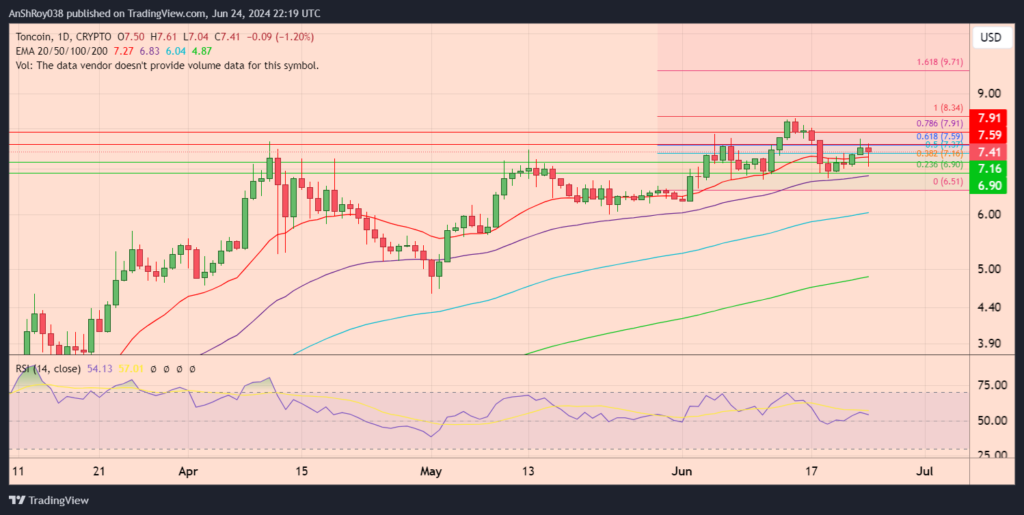
Conversely, a fall from here would push TON price below the 20-day EMA (red) trendline to the 50-day EMA (purple wave) support level near $7.16, which has held strong since June 3. Breaching the immediate support could force TON price to test the support near $6.9.
The relative strength index for TON remained neutral, with a score of 54.13 on the daily charts.